Turns out, I have my own COVID-19 story to tell. No hospital involved, and now an opportunity to think about some of my favorite things: false negatives and Bayesian probabilities. I am both surprised and disappointed.
The first post in this series was March 13, in case you’re just joining and want to see the progression. I’m now posting the bottom line figures for each state and province on the same post that just gets updated each day.
About a week after my first post on COVID-19, it was clear that the situation was getting serious, and I started taking my temperature every day as a check. That made me feel like I was doing something constructive in addition to reducing contact with others. Then Friday March 27 I popped the thermometer out of my mouth and 98F! Two degrees higher than I’d been seeing for a week. I couldn’t believe it. So I popped it back in for longer. Same result. I felt more or less OK, so carried on with my day. However, I started feeling a tickle in the back of my throat, and by that evening I had a regular dry cough and the fever was up to 99F. Fever and a dry cough are the two most common symptoms of COVID-19.
I’m no newcomer to lower respiratory tract infections (AKA chest cold), so I started my usual regimen of a long acting cough suppressant/expectorant, humidifier, nighttime decongestant. The cough worsened some over the weekend, and by Monday I was feeling very fatigued and my chest was tight. That feeling you get after you’ve held your breath just about as long as you can, but all the time. I talked with a GP via phone that afternoon, and diagnosed me with acute viral bronchitis. She also ordered a COVID-19 test because of my history with Asthma and Type II diabetes (both well controlled in my case). She said I would probably be able to get the test at a drive through clinic Tuesday afternoon, and the results would take 3 days.
I awoke Tuesday to a somewhat anti-climatic feeling – I didn’t feel better but I didn’t feel worse either. A nurse from the local hospital doing the testing called that morning to tell me where and when to go, and said the results would take 4 days. Tuesday afternoon I drove myself to the clinic, where a nurse in full personal protective gear from head to toe took a nasal swab. Not comfortable, but not bad in the grand scheme of things. I rather have an nasal swab than get my teeth cleaned. That nurse told me it would take 4-5 days to get the results. Hm.
The most dramatic thing that happened over the next 5 days was nearly running out of coffee on Thursday. Every day I reported to all the various people looking out for me, “I don’t feel better, but I’m not worse either. Win!” I dragged myself out of bed, worked for an hour or two, lay on the couch for an hour or two, ate, rinse and repeat. Friday evening and Saturday (days 8 and 9) were the worst for fatigue and cough. My ribs hurt from coughing. No sign of the test results. I made dark jokes about the results coming in time for an accurate cause of death. Seriously though, having the test result wouldn’t change how I was being treated (“take two tylenol and call me in the morning”), so my main hope was for a positive result so I could laugh in the face of this pandemic going forward.
Today, Sunday, is the 10th day since my symptoms started, and 5 days since my test. I’m not better, but not worse either, win. No exclamation point, this is getting old. I get a call with my test results: SARS-CoV-2 not detected. Nurse says, that doesn’t really mean anything, stay isolated. I’m a bit bummed out about that – I really was hoping to confidently say I’m immune after I get over this thing.
So, I’ve been sick with something, what am I sick with?
False negatives
I have a thing for false negatives. So when I got my negative result this is the first thing I thought of. How likely is it that I have COVID-19 but got a negative result anyway? There are rumors about the interwebs that the probability is high, but is there a reliable source for that information?
A quick google search led to some manufacturer’s websites, but those had no numbers. They did indicate that the tests had received “Emergency Use Authorization” from the US Food and Drug Administration (FDA). Off to the FDA website! I found the guidelines for getting an EUA for a molecular diagnostic test. And NUMBERS! A test has to be positive for at least 19/20 known positive samples at 1 - 2 times the limit of detection. That implies a false negative rate < 5%. BUT what is this limit of detection nonsense? Turns out, there is no requirement for the level of detection. Whatever it is, determined by spiking virus particles into samples at known concentrations, that’s fine. It’s defined as the concentration where at least 19/20 samples come back positive.
Back to google with more specific search terms, and I found this from the Center for Evidence Based Medicine. There were two studies, both judged of low quality, comparing the sensitivity of throat vs. nasal swab samples in people presumed to have COVID-19. The larger of the two studies reported 147 / 204 = 72% of nasal swabs from people with mild symptoms were positive using a RT-PCR assay. That’s not great! There might be lots of reasons why that number doesn’t apply to my test, such as maybe my test used a different type of RNA primer, or the sampling technique was different, or … you get the idea. But I’m of the opinion that some bad data is still better than no data, so 28% false negative rate. If I assume a uniform Beta(1,1) prior, the posterior distribution is Beta(58, 148), which gives me a 95% credible interval of 0.22 - 0.34.
There are anecdotal reports that the false negative rate in the USA is 15% or 25%. I could account for these two anecdata by using them to modify my Bayesian prior. I have to decide how big a “sample size” to attribute to these anecdotes. The smallest integer values that could give me 15% or 25% are counts out of 20, so I’ll start there. Starting from Beta(1,1), I would get Beta(1 + 3 + 5, 1 + 17 + 15) or Beta(9, 33). Expected value is 0.21 and 95% credible intervals 0.11 - 0.35. That range overlaps the published one, so probably in the right ball park. I can then combine the data with this USA based prior, which gives me Beta(67, 180). Expected value is 0.27 and 95% credible intervals 0.22 - 0.33.
OK, something like 1 out of every 5 to 1 out of every 3 people sick with COVID-19 will test negative for the virus. What do I do with that information?
Alternative hypotheses
I need to figure out what the alternative hypotheses are. If I don’t have SARS-CoV-2 replicating in my lungs, what is? The diagnosis is Acute Bronchitis, and it turns out there are a lot of things that can give you that. I’ve had the Pneumonia vaccine, so probably not the bacterial kind of infection. I got my flu shot so that reduces the likelihood it’s a flu virus. Rhinovirus (cold virus) is possible, but I didn’t have any upper respiratory tract symptoms (runny nose etc). But that still leaves a bunch of things including one of the other 4 coronaviruses that already circulate in the human population. 5% of adult americans get a diagnosis of Acute Bronchitis in any one year, but that number includes all of the above.
However, if I make my calculation conditional on a medical professional thinking the symptoms are severe enough to warrant a COVID-19 test, then I don’t need to worry about the population prevalence of the COVID-19 or alternative hypotheses. According to the COVID tracking project there have been 323 positive and 5,139 negative tests in Nebraska. So I just need to calculate the probability of each hypothesis given the data … First off, what’s the probability someone a medical professional orders a test for has COVID-19?
\[ p_{C19}\left(1-s\right) = p_{obs} \\ p_{C19} = \frac{p_{obs}}{\left(1-s\right)} \]
s is the probability of a false negative, and \(p_{obs}\) is the observed probability of a positive test. I spent some time trying to figure out the distribution of \(p_{C19}\), which is a ratio distribution, but my limited math skilz weren’t up to the job. So I’ll rely on simulation.
library("tidyverse")
sims <- tibble(
  p_obs = rbeta(10000, 323, 5139 - 323),
  s = rbeta(10000, 67, 180),
  p_c19 = p_obs / (1-s)
)
ggplot(data = sims,
       mapping = aes(x = p_c19)) +
  geom_density()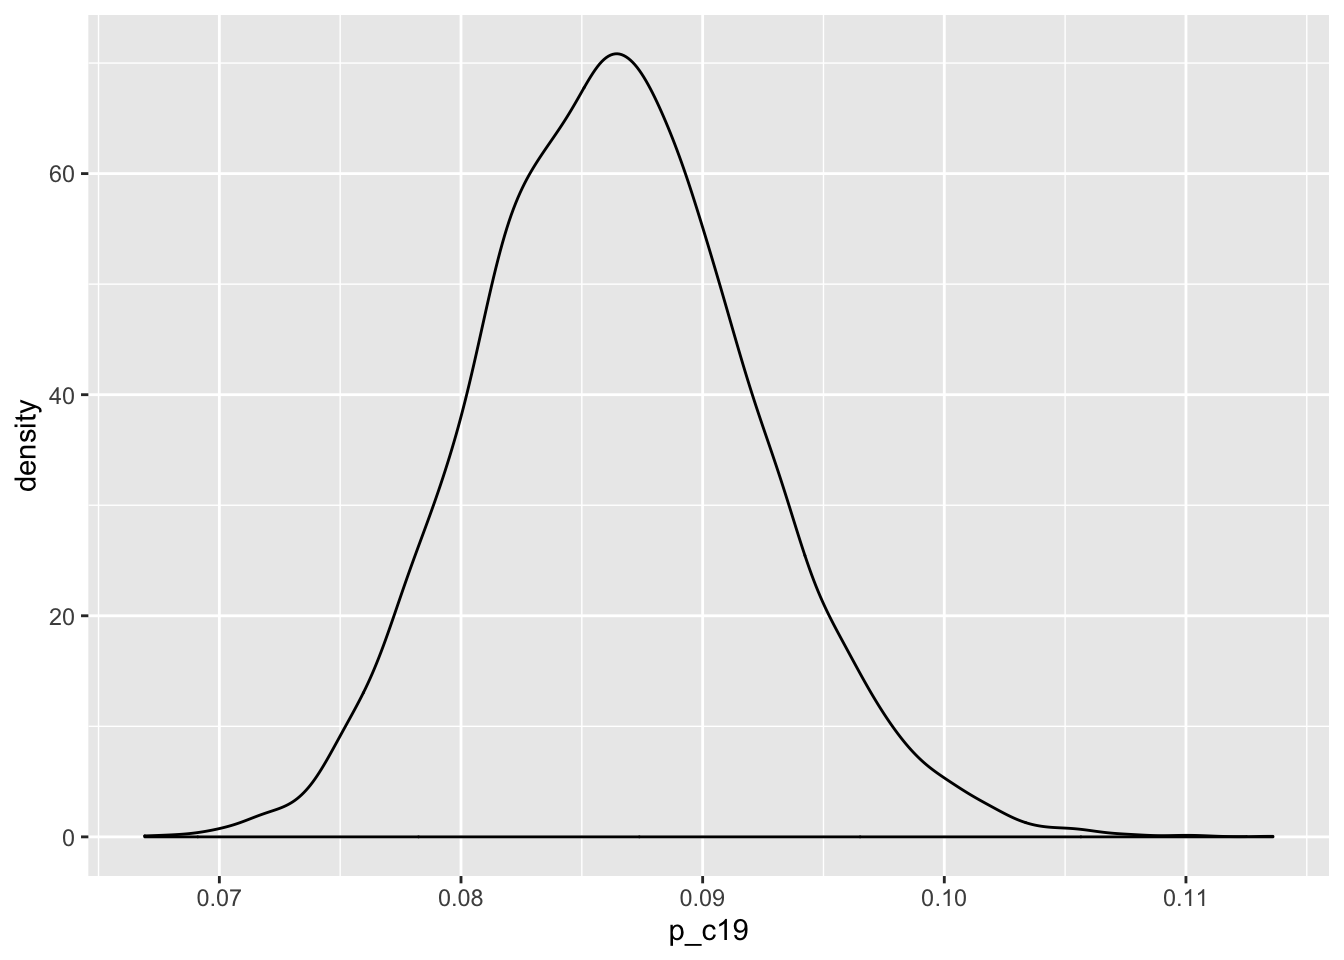
OK, now, what’s the probability that I have COVID-19 given I have a negative test? This is where the conditional probabilities come in.
Conditional probability
The probability of an event B, conditional on some other event A is
\[ p(B | A) = \frac{p(A | B)p(B)}{p(A)} \]
and this lovely thing is called Bayes Theorem, after Reverend Thomas Bayes, and is the source of all Bayesian statistics too. B is me having COVID-19 given I am in the tested population. A is the negative test. I simulated \(p(B)\) above. \(p(A|B)\) is the probability of a negative test given I had COVID-19, so that is just \(s\) from above. That just leaves the probability of a negative test. This can happen two ways. The first is that I don’t have COVID-19, and the test returns a negative result. It’s possible that probability is less than 1, because along with false negatives there are also false positives. But let’s pretend that’s zero for now. The second way is that I do have COVID-19, but I get a negative result, which is \(s\) again. \[ p(A) = (1-p_{C19}) + s\,p_{C19}\,. \]
And now I just substitute everything into the right places.
\[ p(COVID-19 | Negative\; test) = \frac{s\,p_{C19}}{(1-p_{C19}) + s\,p_{C19}} \]
sims <- tibble(
  p_obs = rbeta(10000, 323, 5139 - 323),
  s = rbeta(10000, 67, 180),
  p_c19 = p_obs / (1-s),
  numerator = s * p_c19,
  denominator = (1-p_c19)+s * p_c19,
  p_infected = numerator / denominator
)
ggplot(data = sims,
       mapping = aes(x = p_infected)) +
  geom_density() +
  labs(x = "p(COVID-19 | Negative Test) in Nebraska",
       y = "Probability Density")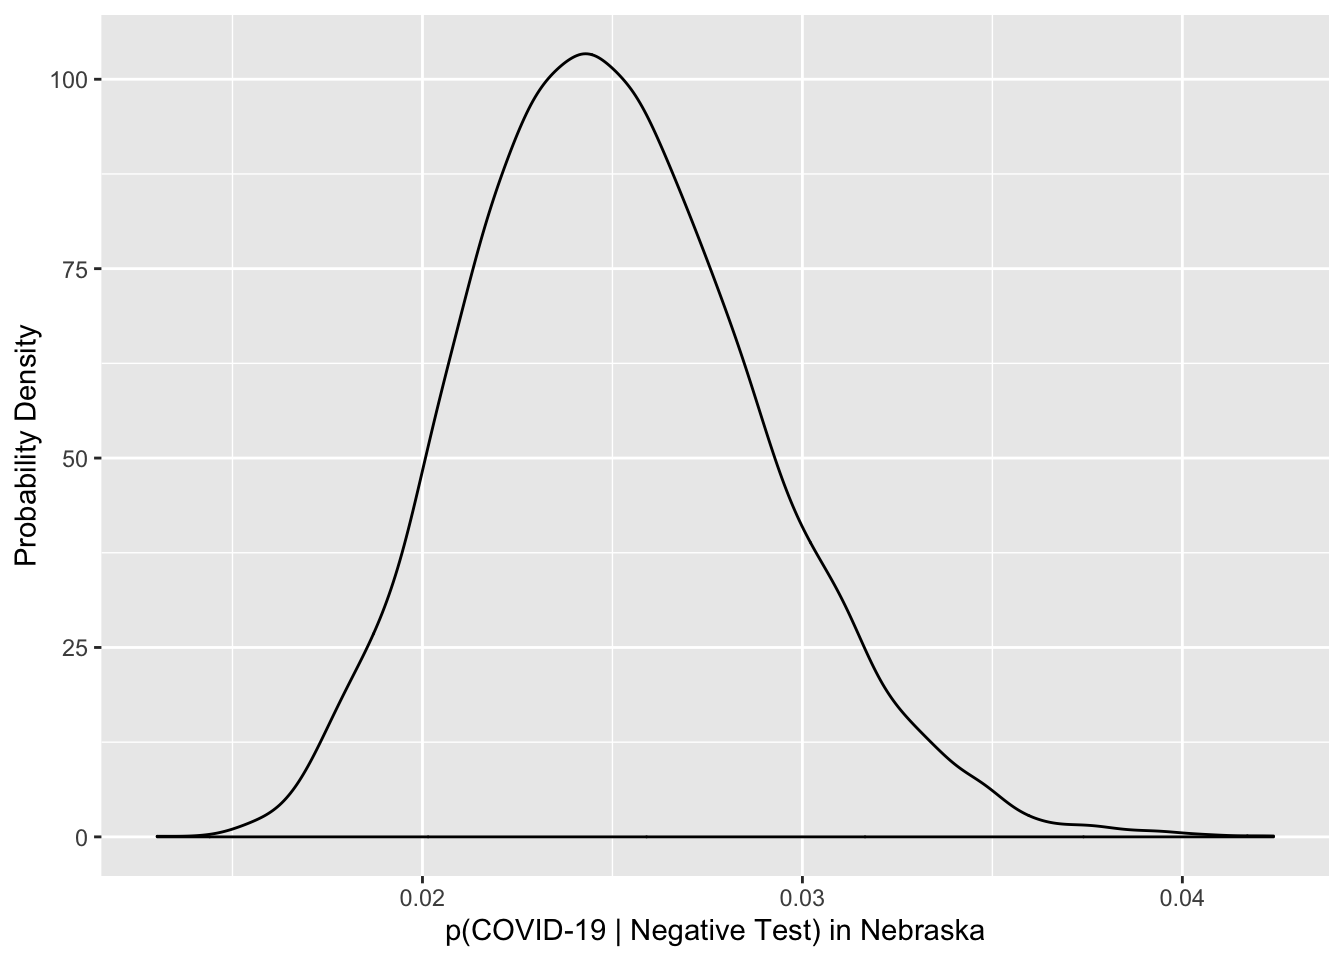
Well, bummer. Looks like I’m most likely (median probability 0.975, 95% CI 0.967 - 0.981) sick with one of the gazillion other viruses that cause Acute Bronchitis. Of course, that doesn’t mean I should run around coughing on people. I can still make them sick, just not with COVID-19. Nor should I stop social distancing, because I could still catch SARS-CoV-2! And I might still be sick with COVID-19, but the odds are against it.
So despite all the warnings that FDA makes about negative test results not being useful, in fact, they are quite useful. The negative test cuts my probability of having COVID-19 from ~10% (corrected for false negatives) to less than 3%. That’s not nothing. Note that I haven’t calculated anything like the probability that a random person in Nebraska is sick with COVID-19, which is what everyone really wants to know. I’ve calculated the probability that someone a medical professional orders a covid-19 test for, has COVID-19 given a negative test result.
It always surprises me when medical diagnoses don’t use prior information, or combine information about different symptoms in a meaningful way. The result I got here surprised and disappointed me. Shows the value of careful thinking.
