Tuesday’s number of new cases in the USA are inside the prediction interval, but are still below expectations. Italy’s numbers continue showing clear signs of a slowdown relative to exponential growth. Nonetheless, Italy continues to add more severe cases per day than their ICU bed capacity. Unless things change drastically, I predict the USA will start to exceed ICU bed capacity by March 23, maybe sooner in some locations. Certainly by the end of March.
That outcome is not set in stone. The time to act is now. Even a one day delay in reducing transmission rate
dramatically increases the peak number of sick people. If you’re lucky to be
in a low risk group, you can still spread the virus. Although your symptoms are mild,
the person you hand the virus off to could experience much worse symptoms. You don’t
have to hermetically seal your house. I like this graphic:

The bottom line
DISCLAIMER: These unofficial results are not peer reviewed, and should be treated as such. My goal is to learn about forecasting in real time, how simple models compare with more complex models, and even how to compare different models.
Another way to put the above: you get the research you pay for!
The figure below has changed quite a bit, and so I’ll highlight some key points here. The y axis is now cases / 100,000 people to make it easier to compare Italy and the USA. As before, the BLUE LINES are exponential growth models that assume the rate of increase is constant. The dashed lines are predictions from that model. The estimated model and predictions for both countries are on both panels. The lines and intervals for the other country are faded out. The RED LINES are 20 x the number of ICU beds per 100,000 people in each country.
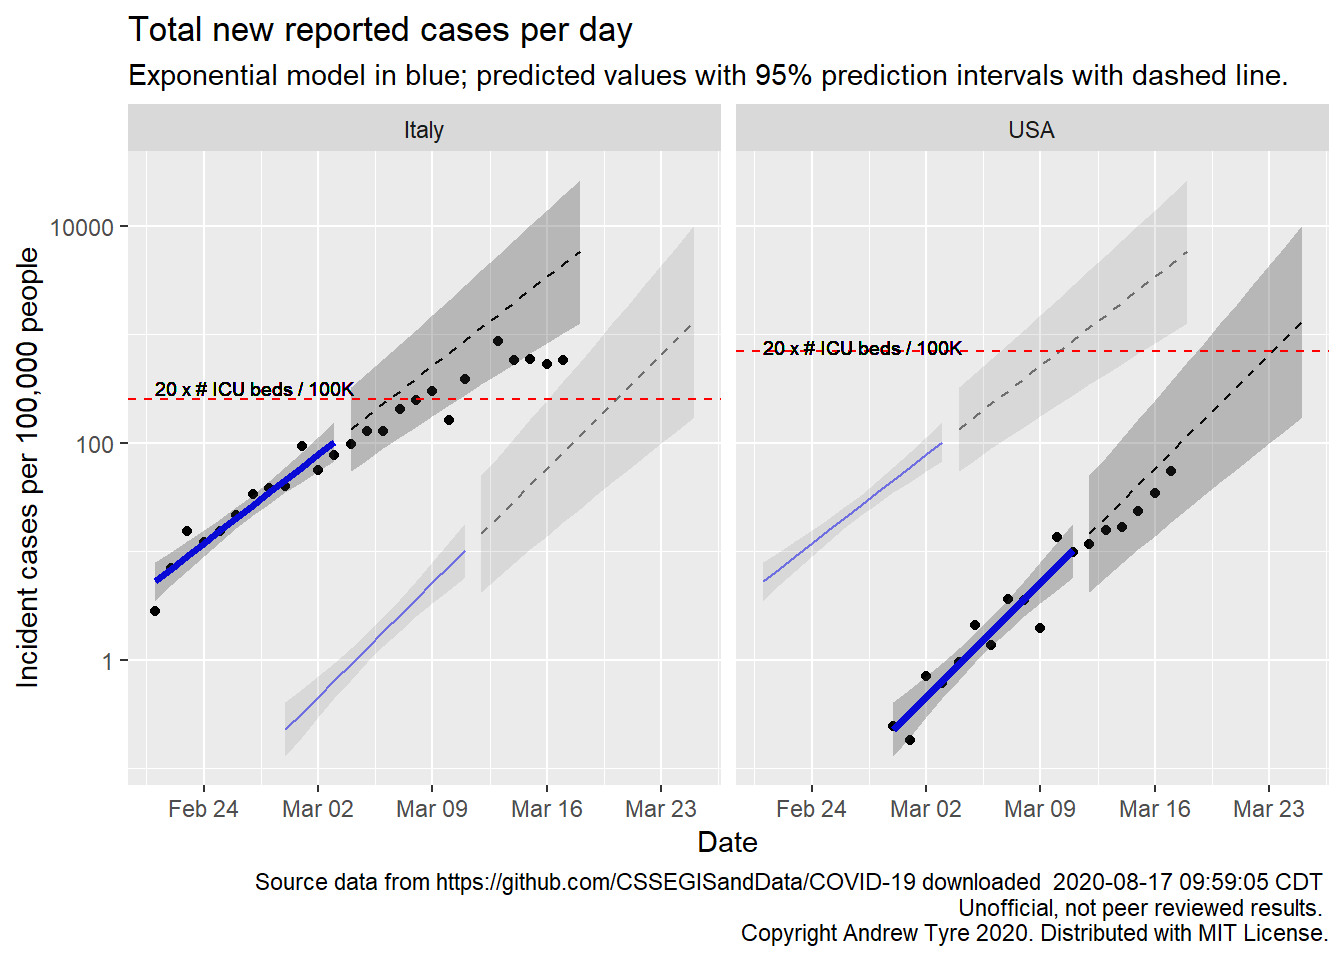
Much as yesterday, Tuesday’s new cases in the USA are inside the prediction intervals but below expectations for the exponential model1. Italy’s numbers continue to fall outside of the prediction interval for the exponential model. Cases are growing faster in the USA than Italy during the first couple weeks because the lines are converging.
The horizontal red lines are the 20 x number of ICU beds per 100,000 people. I multiply by 20 assuming that only 5% of cases need ICU beds. It’s easy to see why things are going so poorly in Italy even though the growth in the number of new cases has leveled off. Every day they are adding more severe cases per capita than the number of ICU beds. And that assumes all the beds are available – they weren’t to begin with and certainly not now. In addition the cases are not evenly distributed geographically; some parts of Italy have a much higher number of cases per capita than others. This is also true in the USA. California, Washington state, and New York state will overwhelm their ICU capacity sooner than the rest of the country.
Unless things change radically, I expect USA to be in a similar pickle as Italy after March 23, certainly by the end of March.
Could be sooner in some places. There is a lot of uncertainty around the red line that isn’t accounted for. After I wrote that prediction (honestly), I read this CNBC report in which Governor Cuomo suggests that 110,000 beds will be needed in mid-May. Looking closely at the numbers in that article, I think there is a lot of confusion about the difference between the cumulative number of cases and the peak daily number of cases. Even many of the really sick people recover! It is clear that someone is giving Governor Cuomo projections, but he obviously doesn’t understand them. More important than the number of hospital beds, or even ICU beds, is the number of ventilators. 3000 in New York state.
Yesterday I made a back-of-the-envelope calculation about the number of true cases in Nebraska, assuming that only 20% of cases get reported. This morning I found this paper estimating that only 14% of cases in China were documented prior to Jan 23 travel restrictions. So my guess might not have been far wrong! It could be worse here, because the frequency of testing is very low. I heard an ancedote of someone being hospitalized with COVID-19 like symptoms, but not tested. In the USA only 31878 people have been tested to date, compared with 42976 in Canada! That comparison gets worse if you recall that Canada has a population ~10x smaller than the USA.
I’m going to call this one good. Keep your distance everyone, wash your hands, and stay positive. This too will pass.
