I’m teaching my population dynamics class using R for the first time. I want the students to use a simple logistic population model to make predictions about how population size will respond to different management actions. So, I need to figure out the best way to implement a discrete time, logistic growth model in R.
EDIT: I’ve added some more thoughts based on twitter discussions with @pixxpih. I also added a bit of discussion of Henry Steven’s implementation in A primer of Ecology with R.
I have students think through the logistic model with graphs of per capita birth and death rates. I don’t expect them to be able to write a function for the model from scratch, so I’m going to give them the code. I’m putting it in a function instead of just doing a for loop in a script to facilitate using functional programming tools (e.g. purrr). I want the function to return a data.frame ready for plotting by ggplot2. Here is the function I’ve come up with. If anyone is aware of an implementation of this model I’d love to hear about it!1
We will use the form of the logistic that uses explicit birth and death rates:
$$ N_{t+1} = N_t + (b_0 + b_1 N_t) N_t - (d_0 + d_1 N_t) N_t $$
This model will have 5 parameters: b_0, b_1, d_0, d_1, N_0 as well as vector of times.
logisticpop <- function(N0, t = 1, b_0 = 1.25,
                        b_1 = -0.01,
                        d_0 = 0.5,
                        d_1 = 0.005){
  N <- vector("numeric", length = length(t))
  N[1] <- N0  # first entry in vector is initial population size
  last_t <- length(N)
  # these next lines will cause warnings if
  # b is not either length 1 or last_t
  if (length(b_0) != last_t) b_0 <- rep(b_0, times=last_t)
  if (length(b_1) != last_t) b_1 <- rep(b_1, times=last_t)
  if (length(d_0) != last_t) d_0 <- rep(d_0, times=last_t)
  if (length(d_1) != last_t) d_1 <- rep(d_1, times=last_t)
  # Now we "loop" and calculate N for each time
  # notice that the code is *exactly* like the equation
  for (i in seq_along(t[-last_t])){
    N[i+1] <- N[i] * (1 + (b_0[i] + b_1[i]*N[i]) -
                        (d_0[i] + d_1[i]*N[i]))
  }
  return(data.frame(t=t, b_0 = b_0,
                    b_1 = b_1,
                    d_0 = d_0,
                    d_1 = d_1,
                    N = N))
}
M1 <- logisticpop(1, t = 0:20)
ggplot() +
  geom_line(aes(x=t, y=N), data = M1)
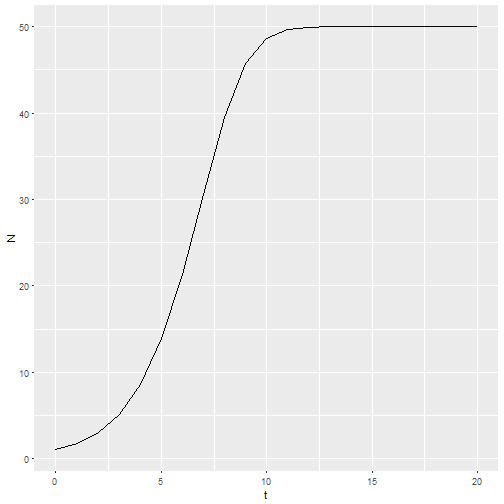
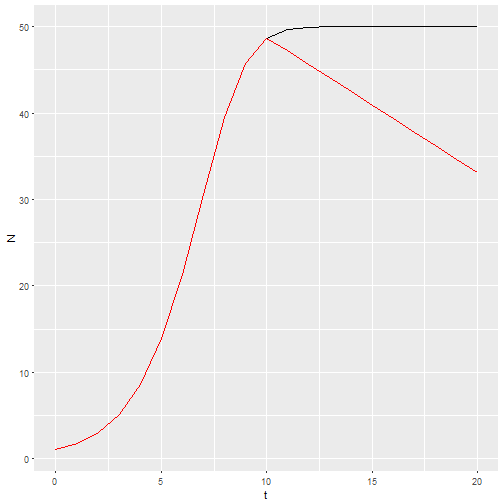
This structure gives me the ability to predict the effects of management actions by providing a vector of birth or death rate parameters. For example, if habitat quality starts to degrade at t = 10, then the intercept of the per capita birth rate could be decreasing.
b_0 <- c(rep(1.25, times=10),seq(1.2, by=-0.025, length=11))
M2 <- logisticpop(1, t = 0:20, b_0 = b_0)
ggplot() +
  geom_line(aes(x=t, y=N), data = M1) +
  geom_line(aes(x=t, y=N), data = M2, color="red")
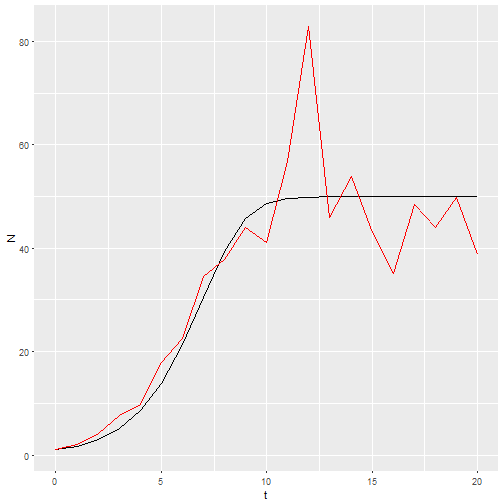
If I want a stochastic model with environmental stochasticity, I simply provide a vector drawn from random numbers.
b_0 <- rnorm(21, 1.25, 0.2)
M3 <- logisticpop(1, t = 0:20, b_0 = b_0)
ggplot() +
  geom_line(aes(x=t, y=N), data = M1) +
  geom_line(aes(x=t, y=N), data = M3, color="red")
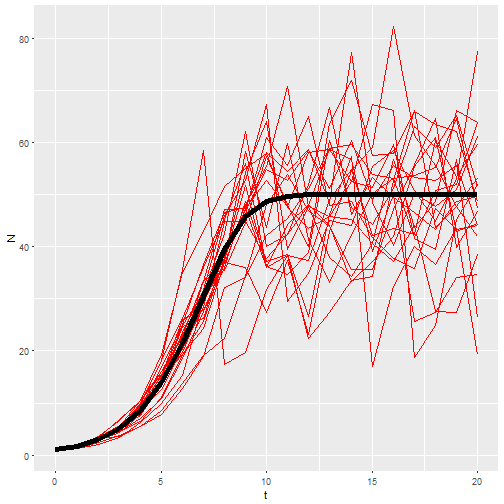
Now I want 20 replicates of that model. This is one place where functional programming comes in. I’ll make a list of b_0 vectors, then use map_df() to call my model with each of those vectors and return the results as a dataframe.
inputs <- map(rep(21, times=20), rnorm, mean=1.25, sd=0.2)
M4 <- map_df(inputs, ~logisticpop(N0 = 1, t = 0:20, b_0 = .x), .id = "rep")
ggplot() +
  geom_line(aes(x=t, y=N, group = rep), data = M4, color="red") +
  geom_line(aes(x=t, y=N), data = M1, size=2)
So that’s my best shot. So far it seems to be working for students to give them the function and have the manipulate the parameters. But lot’s of time left in the semester. Their next assignment is to use a similar function to predict population growth in their flour beetle (Tribolium confusum) populations.
Henry Steven’s dlogistic() function is very similar, but doesn’t accept vector valued arguments, and doesn’t return a data.frame. That’s largely cosmetic, so the basic idea of packaging the model inside a function to use functional programming tools has occurred to at least one other person!
@pixxpih suggested separating the iteration part of the function from the transition part of the function. Karline Soetaert and Peter Hermann do something like this in their book A practical guide to ecological modelling. They just used a naked for loop in a script wrapped around the one step transition function. If this worked out well, I think the iteration function could be re-used for different models, reducing the burden on the students to learn new things, and making it clear that iteration is the general task, while the details of the individual model change depending on the task we have. To make that work with functions that parameterize models in different ways I would need to use ... arguments, and every time I’ve tried to do that it’s ended badly!
- All the code for this post, including that not shown, can be found here. ^
