I set up 4 10 gallon aquaria in the teaching lab this semester. The goal was to observe the nitrogen cycle as the tanks settled in. I also needed an excuse to try out the new Hach environmental water testing kit that we ordered. The data are on figshare.
library(tidyverse)
library(stringr)
aq <- read_csv("https://ndownloader.figshare.com/files/9932452")
# fix missing column name
names(aq)[14] <- "Flag_NO3"
The students measured ammonium, nitrite, nitrate and phosphorous for the first 3 days. Then I took over and measured the first three for another 5 days. TIL: running these tests takes time. Ouch. Anyway, I finally entered all the data, and now I want to take a look. First I will gather it up so all the values are in one column. Makes faceting easier.
aq2 <- gather(aq, key = nutrient, value = conc, NH4, NO2, NO3, P)That’s not quite right because I also need the data quality flag variables to be copied in the right places. Hmmm. I got the general strategy from StackOverflow.
aq2 <- select(aq, -Comment, -Team) %>%
  gather(key = variable, value = value, 8:15) %>% # gather *all* the things
  mutate(flag = ifelse(str_detect(variable, "Flag"), "Flag", "Data"),
         variable = ifelse(str_detect(variable, "Flag"),
                           str_sub(variable, start=6),
                           variable)) %>%
  spread(key = flag, value = value) %>%
  filter(Flag %in% c("Good", "Out-of-range"),
         variable != "P") %>%
  mutate(Date = lubridate::ymd(paste(Year, Month, Day, sep="-")),
         Data = as.numeric(Data),
         Tank = factor(Tank)) %>%
  arrange(Tank, variable, Date)
That got more involved because I needed to extract the “nutrient” part of variable. OK, let’s see what happened.
ggplot(data = aq2,
       mapping = aes(x = Date, y = Data)) +
  geom_point(mapping = aes(shape=Flag, color=Tank)) +
  geom_line(mapping = aes(color=Tank, group=Tank)) +
  facet_wrap(~variable, scales = "free_y") +
  scale_color_discrete(name = "",
                      breaks = c("4","1","2","3"),
                      labels = c("No snails","1 snail", "3 snails", "6 snails")) +
  labs(x = "", y = "Concentration [mg / L]",
       caption = str_wrap("Nutrient dynamics in 10 gallon aquaria with different numbers of snails. Data collected by UNL NRES 222 students, Fall 2017."))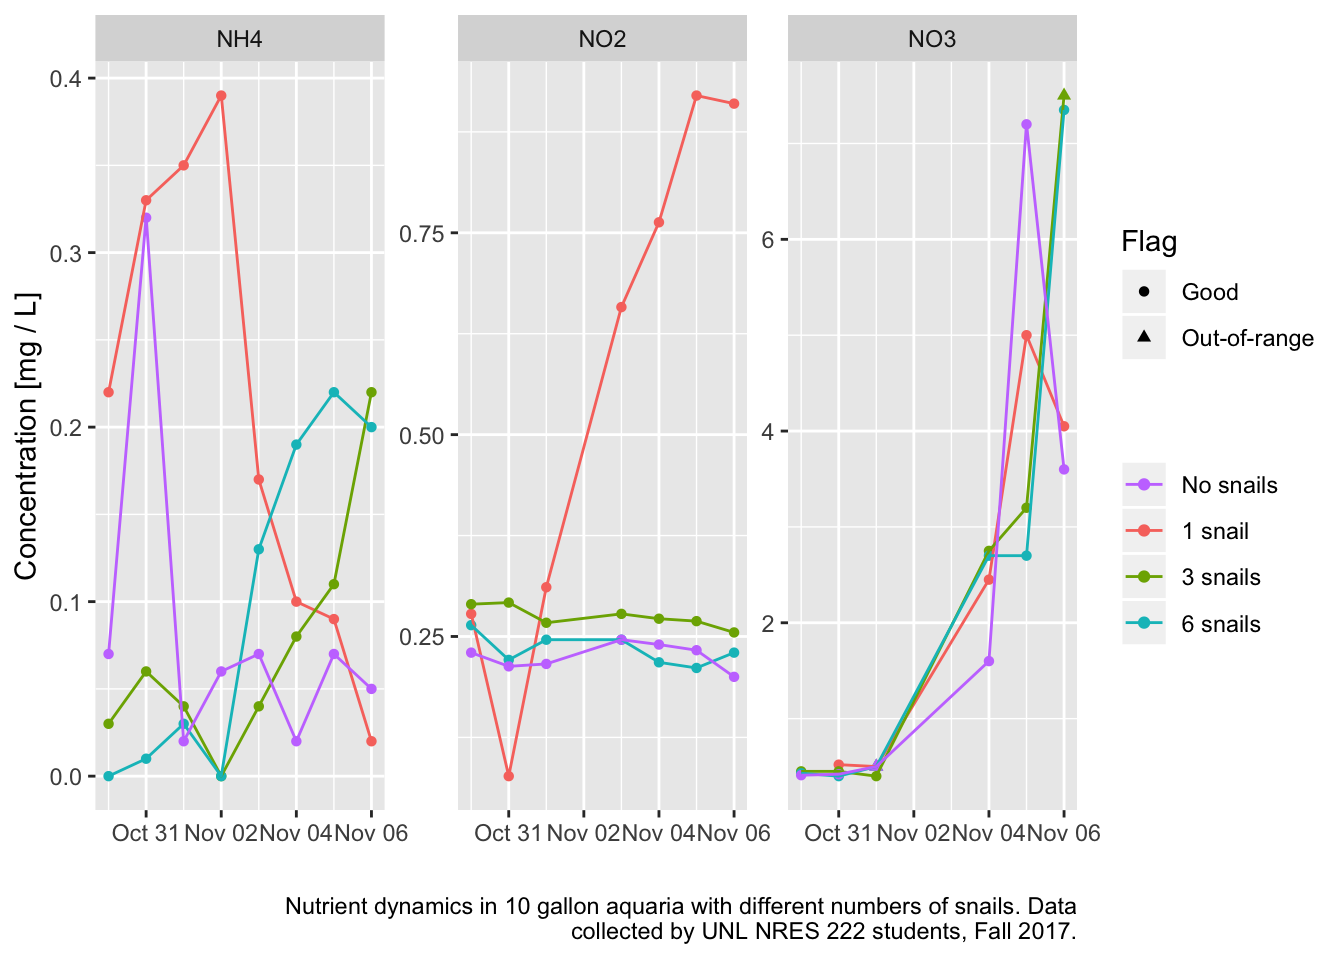
The only tank that did what I expected was the 1 snail treatment. Ammonia rises then falls as nitrifying bacteria ramp up. Nitrite rises, and if I’d gone on longer, presumably falls again. Nitrates start to rise and rise. I’d expected nothing to happen in the no snails treatment, but maybe there was enough Ammonium in the tap water that it drove the nitrogen cycle anyway. I let the tanks sit for 3 days before introducing the snails and starting the sampling on Oct 30. In the other two treatments the snails mostly died. Bad batch of snails I guess.
It looks like this could work as a lab experiment. Better snails, and maybe better quality water to start. Using the one snail tank as a guide, looks like samples a week apart would capture the process.
