I’ve been teaching students ggplot2 for graphics exclusively for a couple years now. One issue that seems to throw students is the specification of different data sets for some layers. Part of the confusion seems to arise from reversing the order of arguments between ggplot() and geom_*(). I’m trying to combat this by always naming my arguments. Is this a good idea?
ggplot() has data as the first argument, while geom_*() have mapping as the first argument. Both have the other argument as the second argument. If I don’t name arguments I do
library(tidyverse)## Warning: package 'tibble' was built under R version 3.5.2data(iris)
ggplot(iris, aes(x=Sepal.Width, y=Petal.Length)) +
geom_point(aes(color=Species))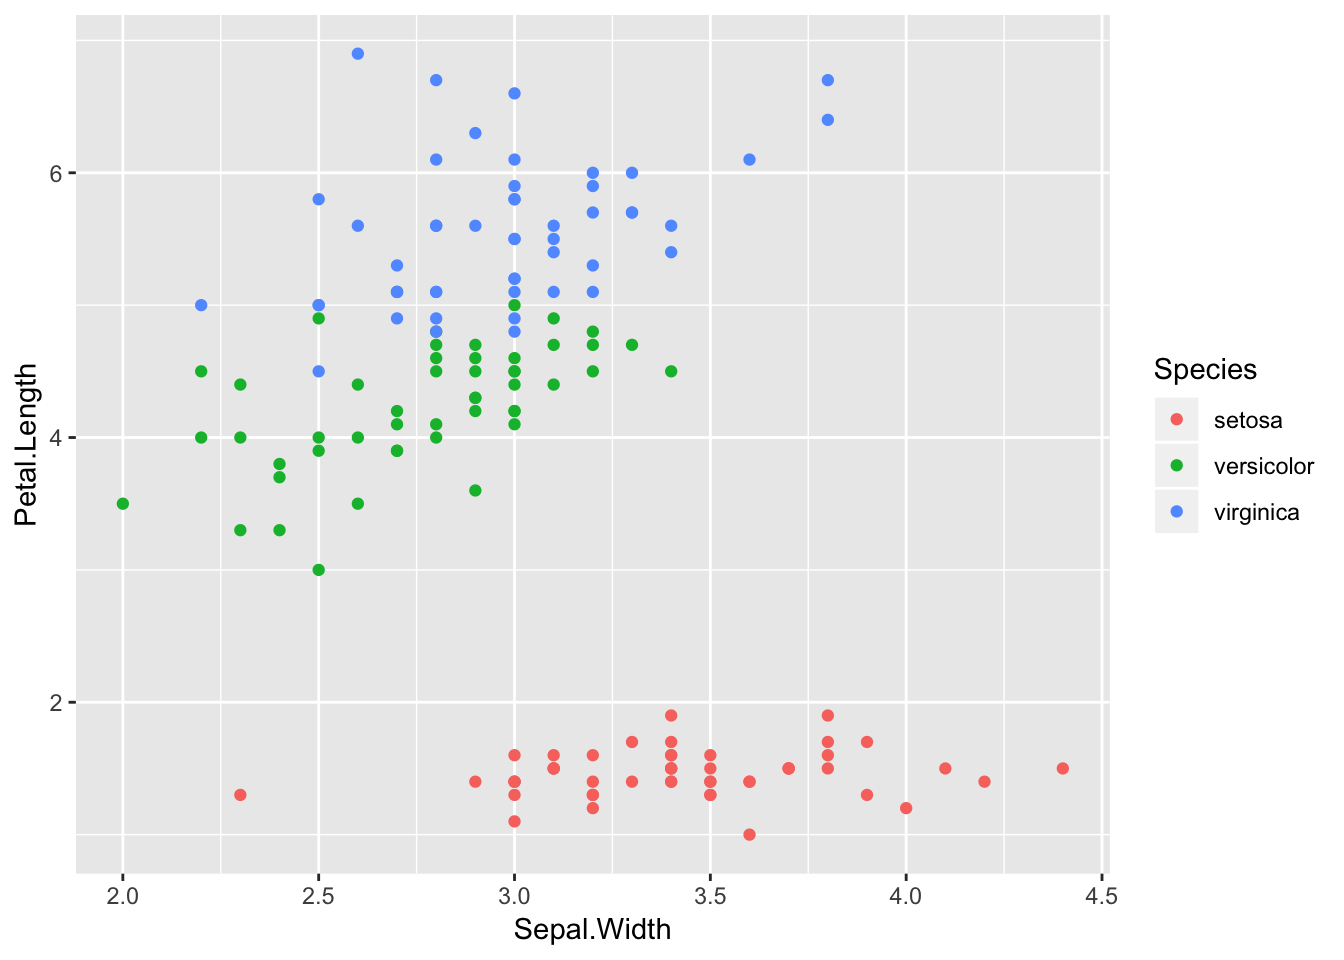
For the most part this is just fine as long as each layer is using the same data frame. However, I frequently ask students to add predictions from a fitted model.1 Just as an example where vanilla geom_smooth() won’t work because there is a 3rd variable that I want to account for in the predictions.2
irislm <- lm(Petal.Length~(Sepal.Width + Sepal.Length + Species)^2, data=iris)
nd <- crossing(Species = factor(levels(iris$Species)),
               Sepal.Width = seq(min(iris$Sepal.Width), max(iris$Sepal.Width), by = 0.01))
sepalstats <- iris %>%
  group_by(Species) %>%
  summarize(minsw = min(Sepal.Width),
            maxsw = max(Sepal.Width),
            medsl = median(Sepal.Length))
nd <- left_join(nd, sepalstats, by="Species") %>%
  mutate(Sepal.Length = medsl) %>%
  filter(Sepal.Width > minsw,
         Sepal.Width < maxsw)
library(broom)
predicted <-  augment(irislm, newdata = nd)
ggplot(iris, aes(x=Sepal.Width, y=Petal.Length)) +
  geom_point(aes(shape=Species, color=Sepal.Length)) +
  geom_line(aes(y = .fitted, linetype=Species, color=Sepal.Length), data = predicted)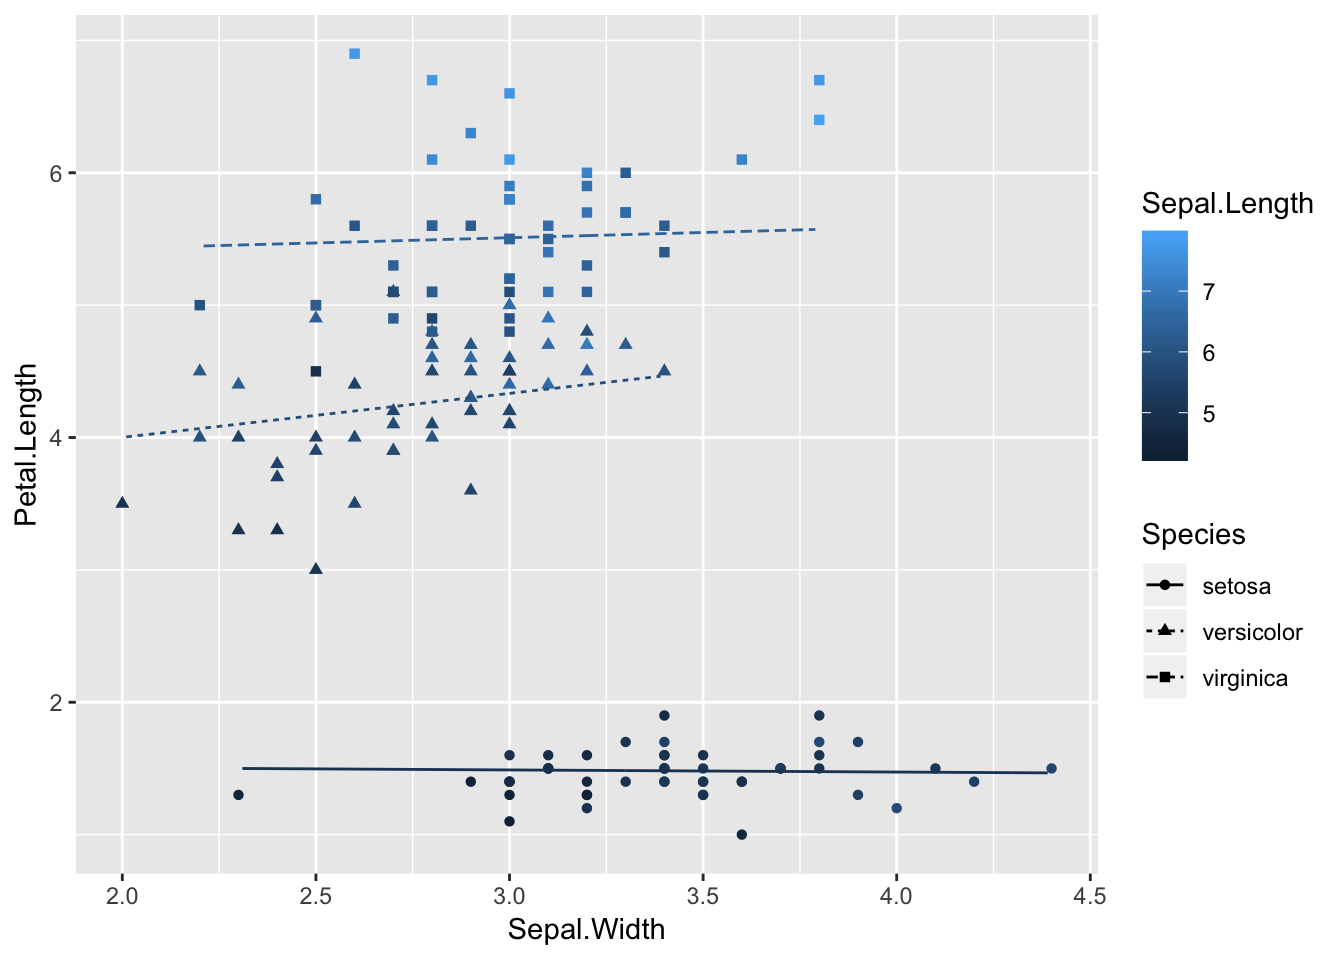
I can’t just change the data argument because the output from augment() uses .fitted instead of Petal.Length. I could rename the output of augment, but that’s a bit risky because then you have two conceptually different things (data vs. expected value) with the same name. So now I’m doing
ggplot(data = iris,
       mapping = aes(x=Sepal.Width, y=Petal.Length)) +
  geom_point(mapping = aes(shape=Species, color=Sepal.Length)) +
  geom_line(data = predicted,
            mapping = aes(y = .fitted, linetype=Species, color=Sepal.Length))
Other than making for excess typing, is there some reason I shouldn’t do this?
Yes, I know I can just add
geom_smooth(). Works great until you start using more complex models that include covariates not on the plot. Or if I want prediction intervals as well as confidence intervals.↩I’m getting a bit carried away here because I suddenly decided I also wanted to have the fitted lines not exceed the limits of Sepal Width for each group. But because I needed the medians for each species anyway this wasn’t too big a deal.↩
