In today’s post I want to summarize some information about what to do (and what not to do) in the face of the COVID-19 pandemic, and examine how my predictions are holding up. I feel a little bit guilty because the topic is serious, and this data reflects real suffering, but I am learning a lot with this real-time forecasting. In my normal work I only get one data point per year. Which means building up skill in forecasting takes a loooong time.
I’ve also realized I have a few different possible audiences with different needs. There are intelligent and interested people like my mother who want the bottom line explained but don’t care how I get there. There are students who want to learn more about how to use R. And then there are some serious data nerds who want to know about my every choice in the analysis and ask why I’m not doing y or z. So I’m going to put the bottom line at the top, so that my mother doesn’t have to scroll too far on her tablet (seriously, this was a conversation we just had). So if you want the gory details scroll down.
The bottom line
EDIT 2020-03-16: DISCLAIMER: These unofficial results are not peer reviewed, and should be treated as such. My goal is to learn about forecasting in real time, how simple models compare with more complex models, and even how to compare different models.
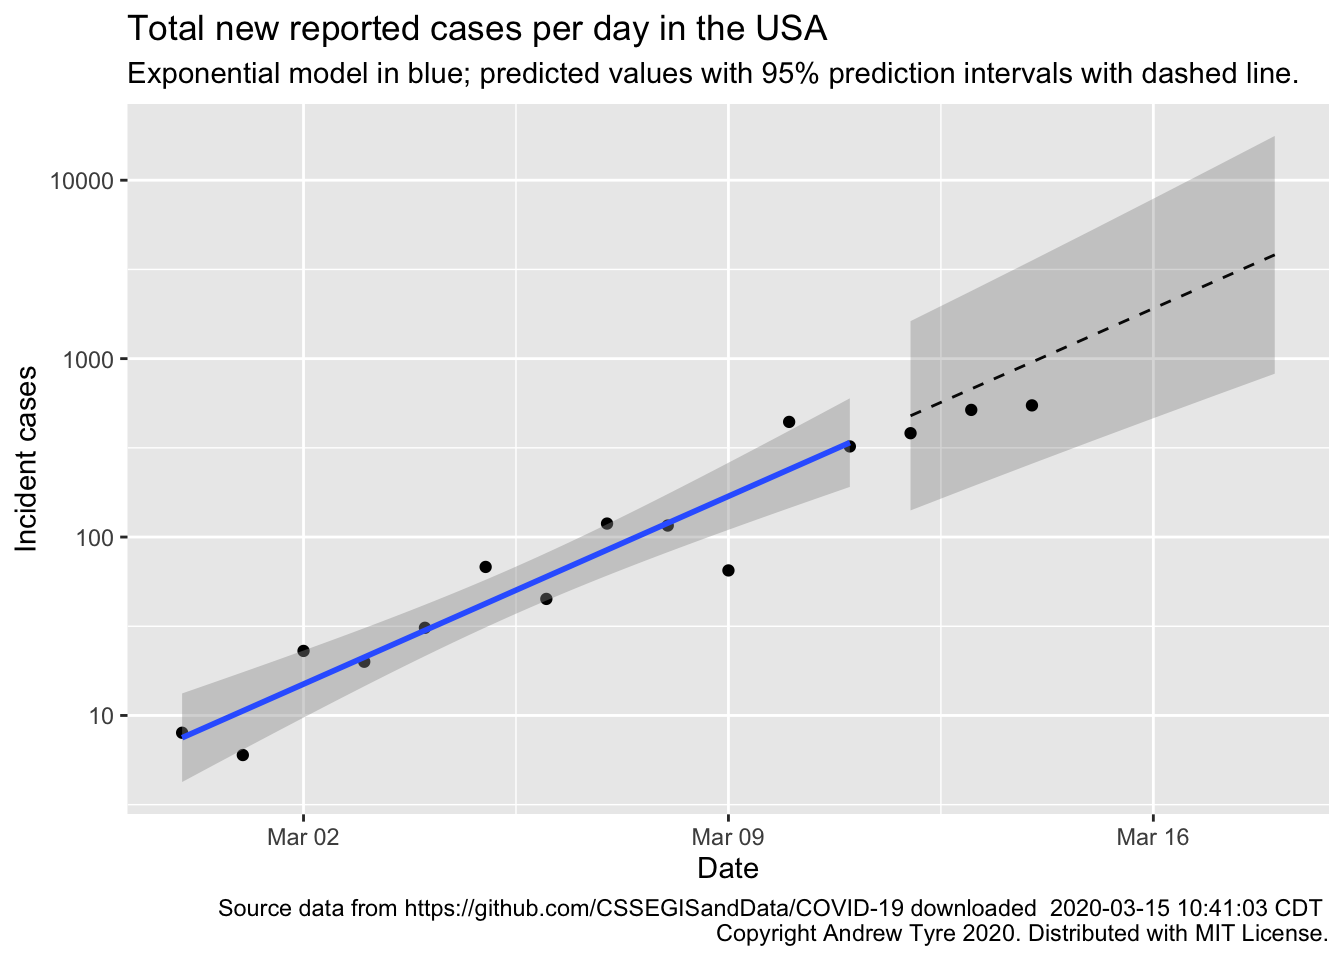
Saturday’s count of new cases in the USA was within my prediction interval.1 The prediction interval is the wider ribbon of grey around the dashed line. For any one day, if you imagine 100 different copies of reality, 95 of the 100 would have new cases that fall inside the grey ribbon. So this prediction is still looking good for my model. However, I would also expect that the points would fluctuate above and below the dashed line. I’m assuming that the rate of new cases per case is not changing. If the “social distancing” is working to reduce the spread, then the number of new cases should start to drop away from my prediction. This is sort of what is shown in the figure, but not severe enough yet to make me throw out my simple model. Yet.
My friend Brenda Pracheil (also a data nerd) offered up an interesting hypothesis for the lower number of cases reported yesterday: the weekend hypothesis. Fewer doctors, clinics etc. open on the weekend, so fewer people getting tested and reported. Too early to judge if that’s happening or not, but I’ll keep it in mind! The point that is farthest off my fitted line is a Monday.
My summary of things to do
Wash your hands especially after going out and touching things other people have touched. Seriously. Soap more effective than hand sanitizer. Use hand sanitizer if you can’t get soap and water, but as long as you don’t touch your face after touching door knobs, etc. you can wait and use soap.
Don’t bother with a mask unless you are already sick with some respiratory illness. Apparently wearing a mask makes you more likely to touch your face, and that’s bad.
If you can, work from home and regardless avoid businesses and activities where you’ll end up closer than 1 m (3 feet) from others. This “social distancing” reduces the number of people you come in contact with per day, which reduces the rate at which the virus spreads. This is not an all or nothing thing. Tomas Pueyo, clearly a fellow (but wealthier and more successful!) data nerd, wrote a great article that shows the effects of social distancing (among other interesting things). This chart in particular shows the benefit of social distancing:
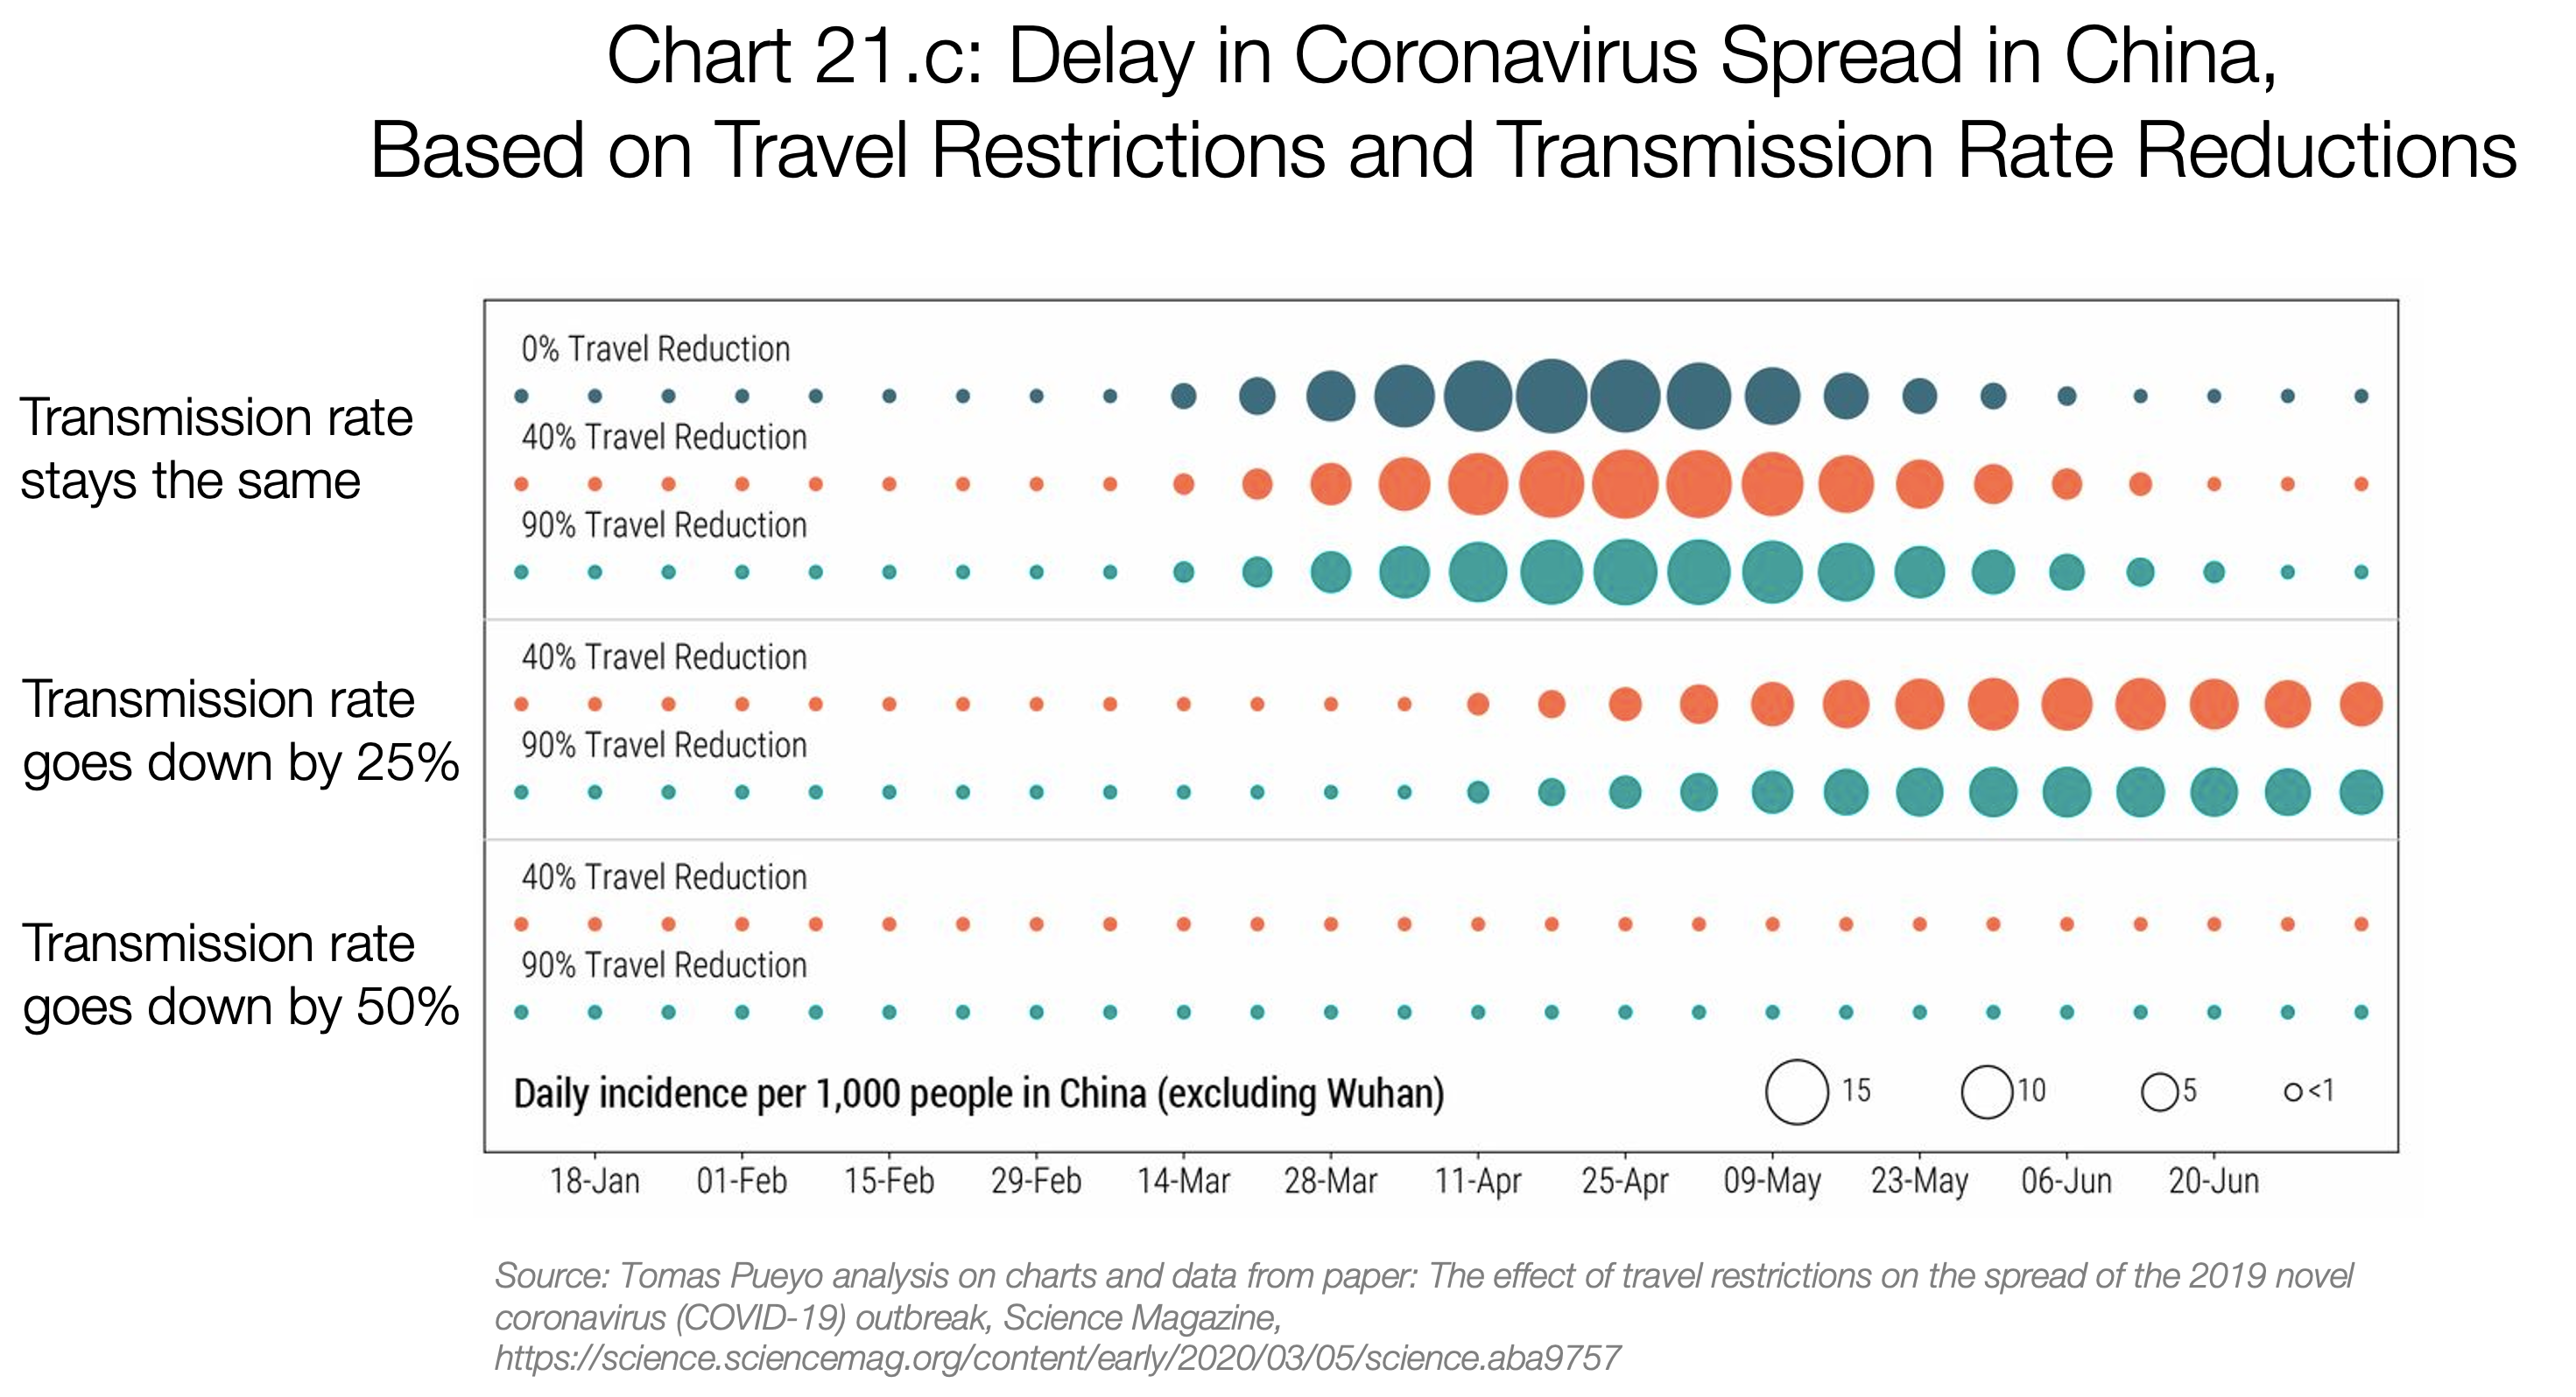 Reducing the number of people you come in contact with by 25% would postpone the epidemic peak by weeks, and reduce the size of the epidemic. A little social distancing goes a long way.
Don’t expect this to be over in 2 weeks. If you’re exposed, and you isolate yourself, after 2 weeks you can be sure you didn’t get infected by that exposure. But the epidemic is going to go on for quite a while! Months. Which leads me to …
Don’t buy enough toilet paper for a year. “Stocking up” reduces the number of times you go to the store for supplies, and isn’t meant to enable you to weather the apocalypse. If you’re in a grocery store, and there is some toilet paper, buy a package even if you don’t need it. But don’t buy 20, that’s just being silly. And rushing around to every store in town looking for toilet paper just increases your contact rate!
Don’t panic. Yes, lots of people are going to get sick, but if you’re healthy and under 60 you are very unlikely to die or even need serious medical help. You should practice social distancing, even so, because that helps the broader community including people that are more likely to suffer severe disease from the virus.
Do offer to help elderly or unhealthy neighbors and relatives. Offer to bring them supplies so they don’t have to risk going out. If you do that, when you deliver, keep your distance! You don’t want to be the vector for someone getting ill.
Stay well everyone, and wash your hands!
