The following figures and outputs are designed to evaluate your readiness to take NRES 803. Type your answers into a TEXT file (NOT a word document!) using a text editor or something like notepad (Windows) or TextEdit (OS/X) or using the RStudio IDE. Copy the question into the file and place your answer underneath it. Save it in a file with the name “yourlastname_is_ready.txt”.
Interpreting graphical and statistical output
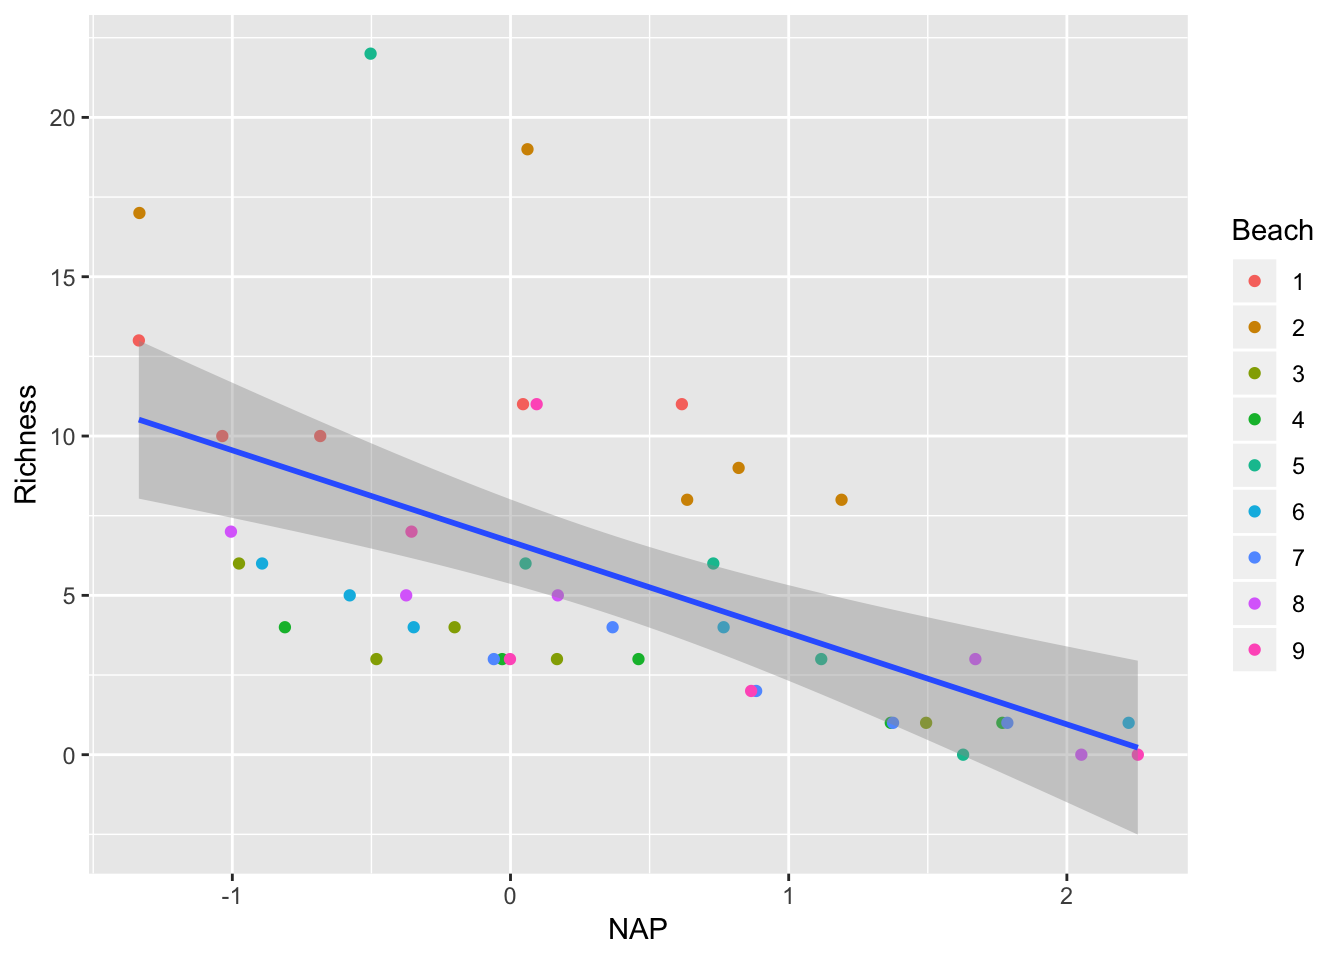
The RIKZ dataset from the textbook has data on species occurence on 9 sandy beaches along the North Sea. Each observation represents a point along a transect perpendicular to the mean low water level. In addition to species richness there are covariates for habitat variables like Height relative to mean low water (NAP), angle of the beach, salinity, temperature and so on.
Species richness declines with height above mean low water. The solid line is an estimated linear model with Richness as the response and NAP as the covariate. The grey area is the 95% confidence region for the estimated mean response.
The following is the output from the estimated linear model.
##
## Call:
## lm(formula = Richness ~ NAP, data = RIKZ)
##
## Residuals:
##     Min      1Q  Median      3Q     Max
## -5.0675 -2.7607 -0.8029  1.3534 13.8723
##
## Coefficients:
##             Estimate Std. Error t value Pr(>|t|)
## (Intercept)   6.6857     0.6578  10.164 5.25e-13 ***
## NAP          -2.8669     0.6307  -4.545 4.42e-05 ***
## ---
## Signif. codes:  0 '***' 0.001 '**' 0.01 '*' 0.05 '.' 0.1 ' ' 1
##
## Residual standard error: 4.16 on 43 degrees of freedom
## Multiple R-squared:  0.3245, Adjusted R-squared:  0.3088
## F-statistic: 20.66 on 1 and 43 DF,  p-value: 4.418e-05
Answer the following questions.
- What is the expected species richness when NAP is 0? Provide both a mean and standard error.
- How fast does species richness change with increasing NAP? Provide both a mean and standard error.
- Is the relationship between Richness and NAP statistically significant? Quote the relevant statistics to support your conclusion.
- Is the intercept of the model significantly different from 0? Quote the relevant statistics to support your conclusion.
- Test the hypothesis that the effect of NAP on richness is different from -1 species/m.
- What is the expected species richness when NAP = -0.5?
Using R to make a graph
Create a new project in RStudio. Download the RIKZ dataset from here and save it into a subdirectory of the project directory called ‘data’. Load the dataset into R and make a plot of grainsize vs. sorting1. Color the points according to which beach they were collected on. Use any sort of graphics functions you are comfortable with, but I will use package ggplot2 throughout the class.
Print out your working directory, and a list of the files in your working directory and all subdirectories. (hint: ?list.files)
Save the R code needed to load the data, make the plot, and print the directory contents into a text file with a ‘.R’ extension. The file should be called “yourlastname_is_ready.R”. In a comment at the bottom of this script, write out the full path to the saved script file. This file should be self-contained. That is, if you run it while the working directory is the project directory, and the environment is empty, it should run and produce the results without any errors.
Submission
Send me BOTH the ‘.txt’ and ’.R’ files by email atyre2@unl.edu. Do not send any data files or saved figures. Do not send a word document.
